Daily Report: Perplexity Evaluation Kicked Off · Experiment Matrix Finalized — Mar 2, 2026
Perplexity Evaluation Kicked Off
After building the test sets yesterday, today the evaluation pipeline is finally running.
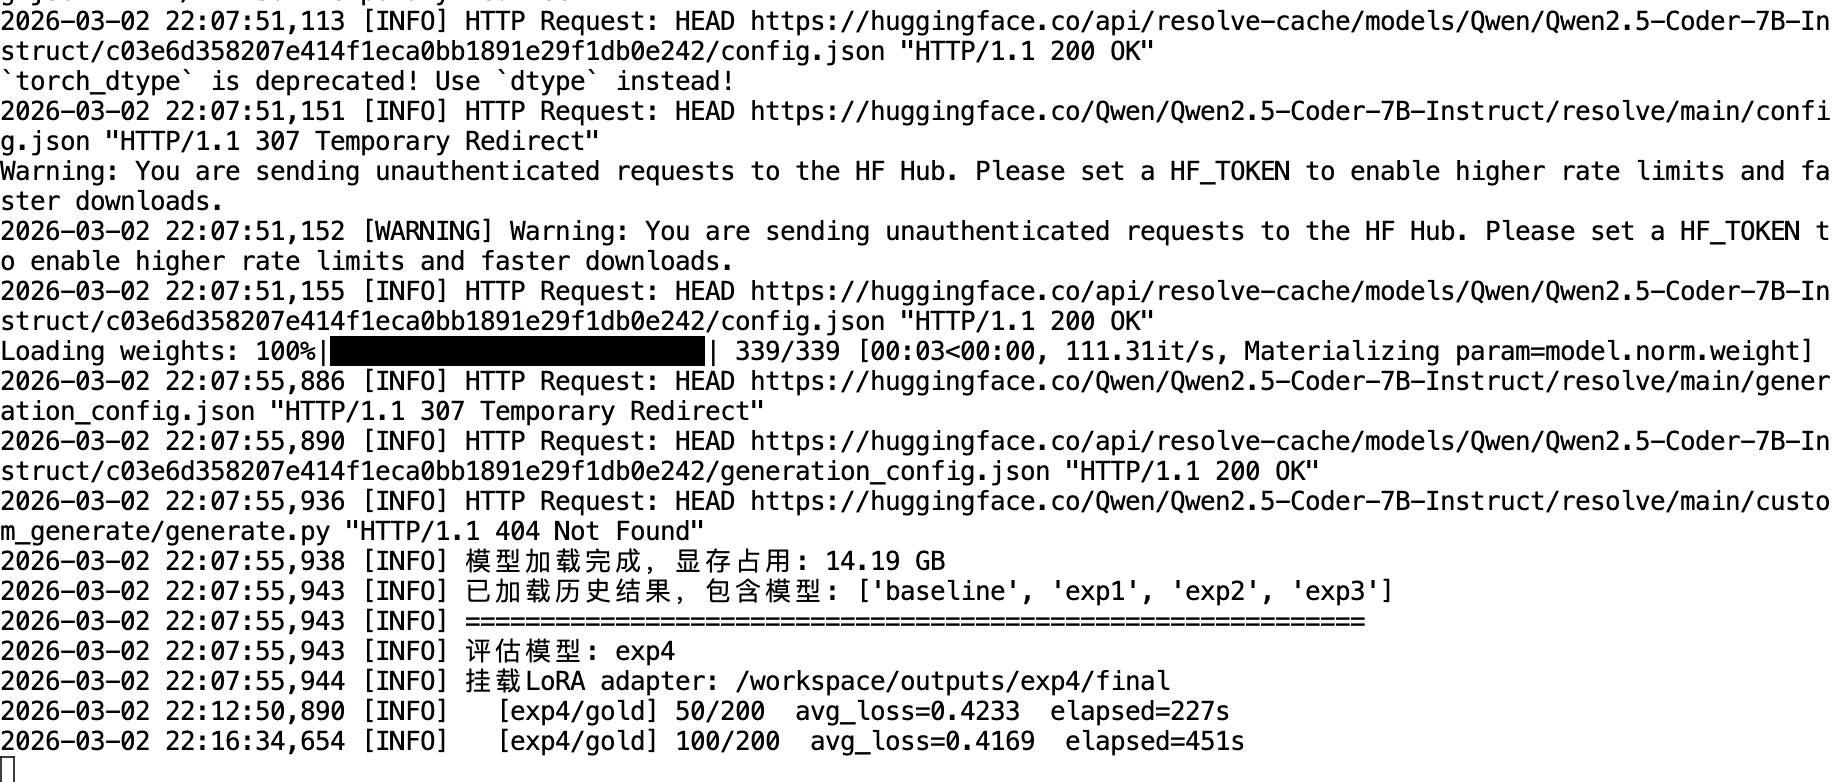
The evaluation script loads each experimental group’s LoRA adapter in sequence and computes the average cross-entropy loss on assistant tokens across three independent test sets. Thanks to history caching, already-completed models are automatically skipped. Currently running: exp4 (TopQ-1000):
[INFO] Model loaded, VRAM usage: 14.19 GB
[INFO] Loaded historical results for: ['baseline', 'exp1', 'exp2', 'exp3']
[INFO] Evaluating model: exp4
[INFO] Mounting LoRA adapter: /workspace/outputs/exp4/final
[exp4/gold]  50/200  avg_loss=0.4233  elapsed=227s
[exp4/gold] 100/200  avg_loss=0.4169  elapsed=451s
Everything looks healthy — model loading is clean and the loss is ticking down steadily.
Experiment Matrix Finalized
While the evaluation was running in the background, I took the time to lock down the full experiment design. The matrix consists of 13 groups + 1 baseline, organized into three research Blocks:
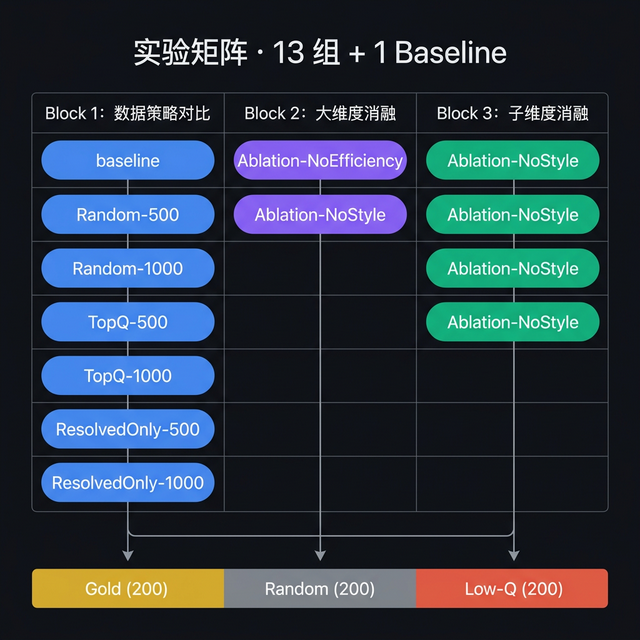
Block 1: Data Volume & Strategy Comparison (7 groups)
The heart of the experiment. This block systematically stress-tests the data selection strategy from three angles:
| Comparison | Research Question |
|---|---|
| exp1 vs exp5 | Does the Gate matter? Full-pool random vs resolved-pool random |
| exp5 vs exp3 | Does scoring matter? Resolved random vs resolved top-ranked |
| 500 → 1000 | Data scaling effect — how much does doubling the data help across each strategy? |
| exp3 vs exp7 | Sanity check — best vs worst selection, verifying the scoring system makes sense |
exp7 (BottomQ-500) is sampled by reversing the composite score ranking — the “bad data” control group. If the final loss gradient holds up, it’s the most direct validation of the entire scoring system.
Block 2: Major Dimension Ablation (2 groups)
Isolates the independent contribution of the two top-level scoring dimensions:
- Ablation-NoEfficiency-500 (exp8): selection based on Style score only
- Ablation-NoStyle-500 (exp9): selection based on Efficiency score only
Compared against exp3 (full composite), this tells us which dimension carries more weight in determining data quality.
Block 3: Sub-dimension Ablation (4 groups)
Drills further into each major dimension to isolate sub-metric contributions:
| Comparison | Research Question |
|---|---|
| exp10 vs exp11 vs exp3 | Inside Efficiency: Error-Retry Cycles vs Step Count Ratio — which one matters more? |
| exp12 vs exp13 vs exp3 | Inside Style: Action Diversity vs Observation Utilization — which one matters more? |
Expected Results
Across all models, the expected loss gradient is:
Loss(Gold) < Loss(Random) < Loss(Low-Q)This gradient serves a dual purpose: it validates the scoring system’s ability to distinguish quality tiers, and acts as the primary signal for whether fine-tuning on higher-quality data actually improves model behavior. A group that achieves significantly lower Gold loss is genuinely learning the high-quality patterns.
Reuse Status
Due to a refinement in the composite scoring formula, some previously trained models’ sample selections are now invalid and need to be retrained:
| Experiment | Reusable? | Reason |
|---|---|---|
| baseline | ✅ Yes | No fine-tuning, scoring-independent |
| Random-500 / Random-1000 | ✅ Yes | Random sampling, unaffected by score changes |
| All others | ❌ Retrain | Score formula changed, different samples selected |
Effective new training runs required: 11 groups.
Tomorrow’s Plan
- Wait for all experimental groups to finish perplexity evaluation (estimated a few more hours)
- Aggregate and compare per-group loss across Gold / Random / Low-Q test sets
- Plot a loss comparison heatmap or line chart to draw preliminary conclusions
- Based on Block 1 results, determine whether to prioritize kicking off the ablation group retraining